Centralize your logs
Crato is an open-source framework for small applications to easily deploy a centralized logging solution that maintains ownership of data.
CRATO


easy log management for small applications
Crato is an open-source framework for small applications to easily deploy a centralized logging solution that maintains ownership of data.
Get started with a few simple commands.
Crato is an open source framework for small applications to easily deploy centralized logging.
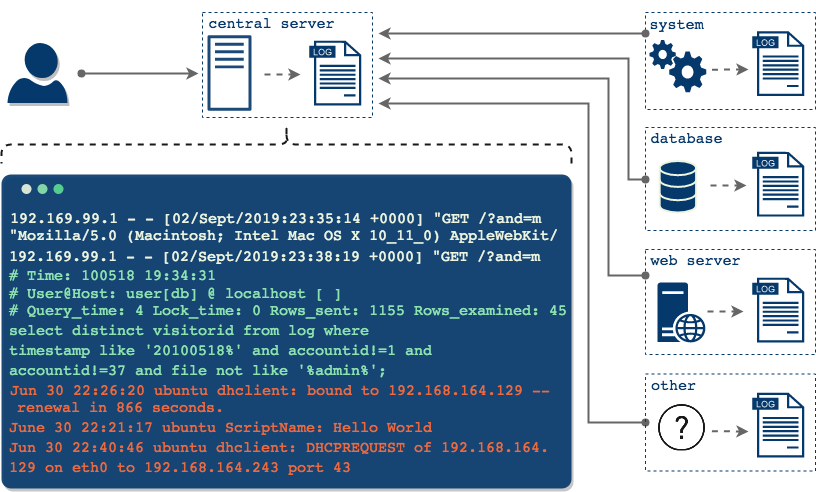
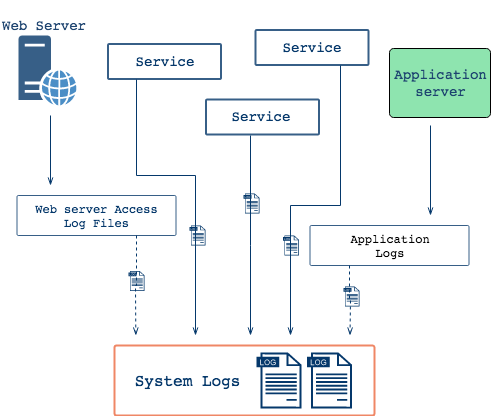
Applications and system services record their events to local log files, but by default these log messages remain on local systems and are eventually either archived away never to be seen or permanently deleted. Without intervening then, developers and administrators lose valuable insight into the history, performance, and security of their systems and applications.
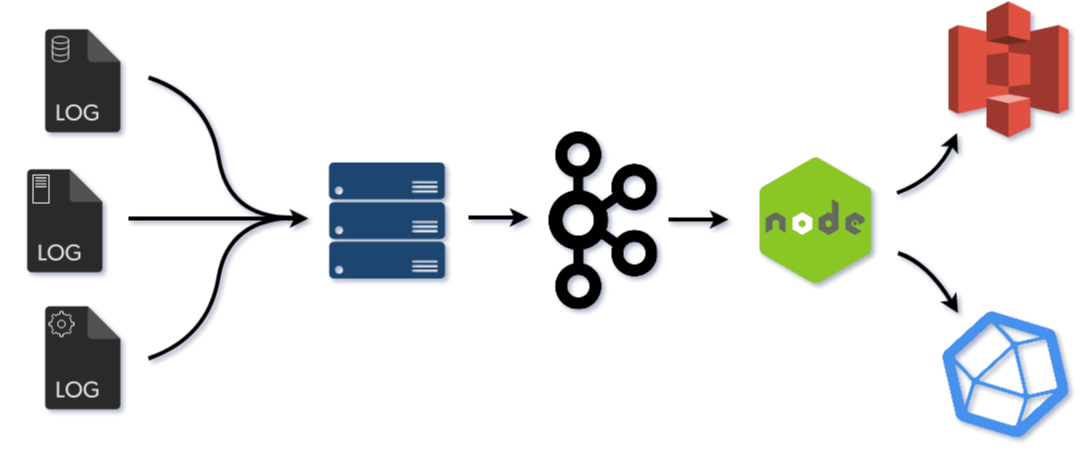
Crato allows developers to quickly and easily deploy a centralized logging infrastructure to address this problem. Using Crato, each machine sends its logs to a central collection server, where developers can gain insight into their entire system by analyzing the consolidated logs across the entire deployed fleet of systems and applications. Besides log data consolidation and analysis (via InfluxDB), Crato also provides smart compression and archiving (via Amazon S3 and S3 Glacier). Crato makes configuring, deploying, and maintaining all these pieces easy and fast.
Before we get into Crato, let's take a step back and discuss what logs are.
Developers rely on logs of all sorts on a daily basis. In the simplest case, we can think of logs as distinct events that get written to files1. Log data is often the primary way to determine application health, debug a problem, or derive aggregate metrics. It's the first place any developer looks to try to piece together what happened in an event of an error or exception. Logs are critical and every piece of software, from infrastructure to operating system services, are continuously logging events as soon as the system is up.
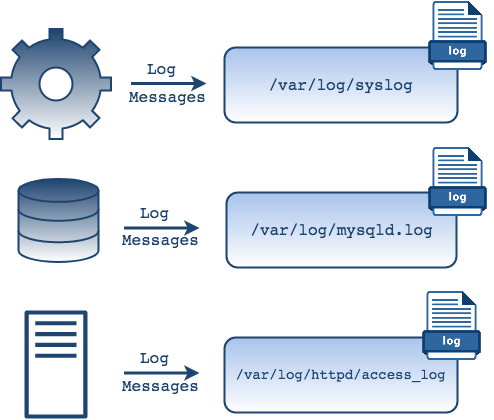
In most UNIX systems, these events are written to log files. For the
most common applications and services, these files can be found in the
var/log directory. Within that directory, some services
will create sub-directories to organize their logs. For example, MySQL
generates its own log file and the httpd sub directory
contains log files for the Apache web server
access_log and error_log. There are also
system process logs that can be found in files like
kern.log or auth.log
that contain information logged by the kernel and system authorization
information, respectively.
Because log messages are generated by some process and get written to
files on our local file system, it's natural to think of logs simply
as files. If logs are just files, then we use commands like
grep to match against some string or regular expression
in the log file.

We can use grep to search a file for logs generated in
the last 10 minutes.
But in order to better understand the structure of application logs, let's consider another description of what a log is. We know that a log is a file but that's not the full story.
"A log is perhaps the simplest possible storage abstraction. It is an append-only, totally-ordered sequence of records ordered by time"
- Jay Kreps
In the simplest case, we have an application that runs on a single server, and our life is relatively easy. When the application is contained on one server, so is its log data - when something goes wrong we know where to look and it's fairly straightforward to paint the entire picture of the application state. However, as applications continue to grow in complexity so does the volume of their log data - the many components, devices and microservices that produce log data are often distributed on multiple servers and even with a relatively small number of users, this can quickly become a big problem of incomplete information. For this reason there has been a greater need to unify log data, both by location as well as format. On top of data consolidation, there's also been a growing need to synthesize the proliferation of logs for business insights. This also implies a growing need for machines to process log data.
In order for a machine to parse and aggregate log data to then be consumed by humans, a text file may no longer be sufficient. But how do we store log data, if not in a file?
The key is to recognize that logs as files are just one form of a more general concept of a log as a data structure. That is, if we regard a log as a time-ordered, append only sequence of records, we can see log files as just one example. In this light, a log and its basic properties can be represented by the following diagram.
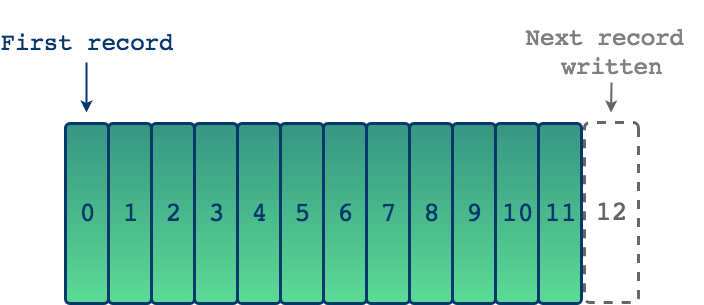
Each entry in a log is added sequentially making this an append-only data structure. We start on the left and each subsequent entry is then added to the right. The entries on the left are then by definition older than entries on the right, giving this data structure a built-in ordering2. Since reads also proceed from left to write, in the context of building an application, if each entry in a log represents some event, we can know the order in which the events occurred. In this way, logs provide a historical context for our applications.
The "Twelve-Factor App" is a set of best practices for building robust and maintainable web applications. One of the guidelines directly address logging, suggesting that we should treat logs not as files but as event streams, and that a web application shouldn’t concern itself with the storage of this information. Instead, these logs should be treated as a continuous stream that is captured and stored by a separate service3.
Of course it's natural to think of logs as files since it's a common way to interact with logs and because log file generation is typically an automatic process that happens behind the scenes. But log messages get written to files mainly because it's a convenient method of storing data. As we have seen, outside of the context of a file, individual log messages can be viewed as time ordered streams of events that can be written to files but that can also be processed in other ways. To borrow another quote from Jay Kreps, "Log is another word for stream and logs are at the heart of stream processing". Streams of data can be directed or split into multiple streams and sent to different locations for further processing.
If we use a command line utility like tail it's possible
to see a live stream of logs that are coming from an application or
any other process we'd like to monitor. So while messages are being
written to files, from this view it's easier to think of logs as a
collection of events that we can view in real time as they occur -
something that's ongoing, with no beginning or an end.

Ongoing, collated collection of events viewed in real time with the
tail utility.
To review, a log at its core is an append-only sequence of records that has a natural notion of "time" because newer records are appended to the end of the log. Taken together, these properties mean that a log effectively captures changes over time, thereby creating a full history of the application.
We most often think of our application's database, where we keep the business logic of our application, as the source of truth. If some data on the UI doesn't look right, we consult the database to determine whether it's correct. But even a database can't tell you how the data got to that state. In some situations, knowing the historical context for how we got to a particular state can be even more important. As espoused by Martin Kleppman, Jay Kreps, and others, this idea is known as the "Stream-Table Duality".
Stream-Table duality is another way of saying that there are distinct but related ways to represent data. The familiar way is of course with a table which represents a snapshot of current state. Let's consider a simple example below using relational data in tables. There are two users and they are transferring funds between one another. As changes occur over time, the data in a table is updated to reflect a new current state.
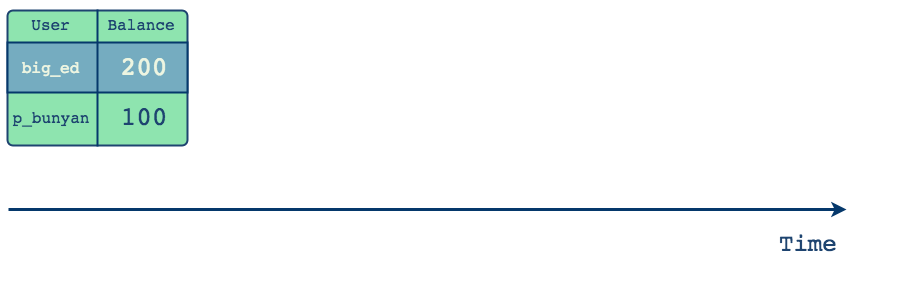
As changes occur over time, the data in a table is updated to reflect a new current state. But how did we get there?
From this example, we can see that data in the table is mutable since the old values are replaced by new values. When we isolate a table and look at it at any point in time, it's possible to answer questions about the current state - for example, what is the current balance of a customer with username big_ed. However, looking only at a database record at one point in time doesn't paint a full picture - there are many ways you could have arrived from one state to another and it is only the log that can describe that journey. The log is the database's changelog and it's there that we can find the full story of how the current data arrived at its current state.
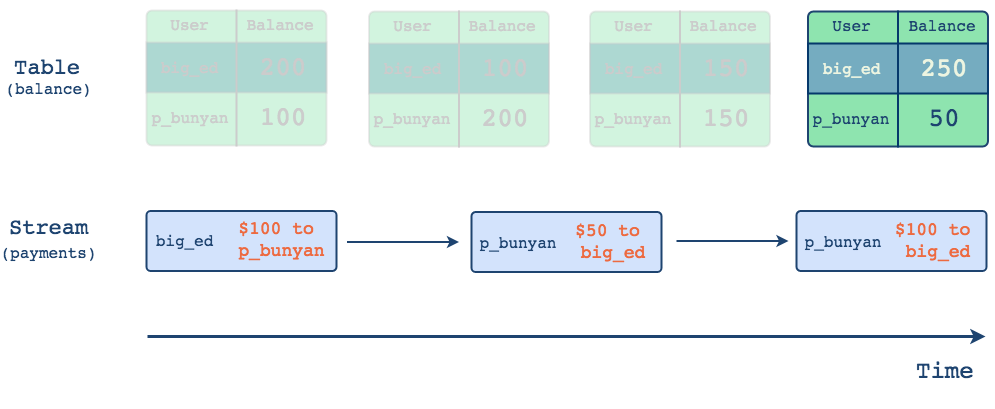
Representing the same history that we saw above but this time as a stream of changes would look like this:
A stream captures the changes between the table's states as distinct events.
From a log-as-stream perspective, the data is immutable since the values are not updated. Instead, distinct and immutable events are appended to the end of the log. What is captured in the blue boxes are the changes between the table's states. This stream of changes can supplement the core business logic that lives in tables and helps answer not only what changed but also why and how it changed4.
Tables show us current state and streams capture how we got there.
And a log is useful in another way besides providing historical context for existing data. Because a log captures the changes themselves, it is possible to rebuild the current state of any database from the database logs alone. In fact, it is possible to rebuild the "current state" of any point in time of the database from logs.
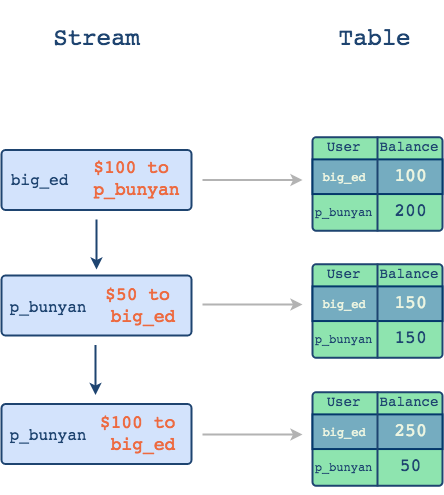
In this way, it's possible to think of a log as the real source of truth since we can recreate a snapshot of the database at any point in time from logs. That is, we can aggregate streams to arrive at tables, but we cannot understand the historical context from only tables.
There are obvious benefits to logging that are important in day to day development. Developers use logs every day for analysis and debugging, infrastructure monitoring and for deriving useful metrics. Some types of applications are also required to keep logs long term for audit purposes. However, besides these uses, carefully curated logs related to your application can provide valuable historical context that unlocks other benefits:
For a small but growing application, there are many options to get started with logging. Despite the myriad of options, many companies opt to deprioritize logging from the outset. Yet, the power of logs can only be realized later; by the time an application owner decides she wants to look at historical data, it's too late to get started as previous data is already lost. By default, many systems delete log data; in some cases, it's archived into various machines and unusable for meaningful analysis. Most small application owners do not think about a logging strategy until significant data is lost.
In the next section, we'll discuss how to get started with Syslog, the standard log recording format on UNIX, and the various architectural deployment options that small application owners have for centralizing and storing their log data.
Previously, we talked about how log files are automatically generated by a logging system on the operating system. Syslog is the most widely used logging system. In fact, syslog is a UNIX standard that defines a message format and allows for standardization of how logs are generated and processed.
Since the original inception of Syslog in the 1980's, there are now various implementations of the syslog daemon, with rsyslog and syslog-ng being the most notable examples. For the purposes of our discussion here, we'll use the generic syslog daemon in our diagrams, however any of the more modern implementations can be used in its place.
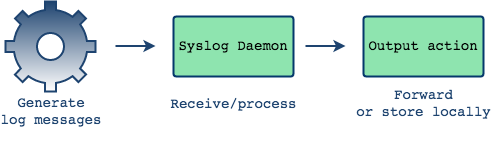
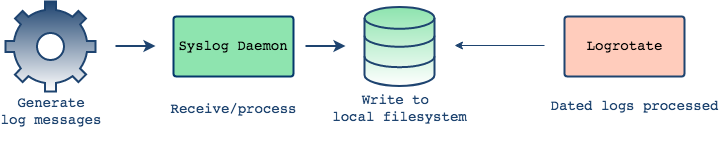
First let's take a look at what syslog looks like locally. In a simple
case, for example on a single node system, the log daemon will receive
log messages and then write them to the local file system as we saw
earlier - typically the files are written to the
var/log directory.
There is a separate process called "log rotation" that is responsible
for compressing, archiving and eventually removing old log files. Log
rotation occurs daily, weekly or when a file reaches a certain size -
this depends on the configuration5. For example, you can choose to keep 3 days worth of logs, in which
case the log rotation process will rename the log file to make room
for the next file, eventually leaving the most recent three files:
example.log.1, example.log.2 and
example.log.3
During the next iteration, the example.log.3 file will
get rotated out and example.log.2 file takes its place
and is renamed example.log.3.
This process occurs behind the scenes in a localized system. But applications are rarely deployed on a single node. There are typically many moving parts and various components across different servers. Each of these components is generating its own log data in real time, so the question is how do you as a developer sift through this data and correlate events from each component?
Imagine that you have an error and you need to refer to your logs to see what went wrong. In this case you would have to individually connect to every single one of the servers one at a time, locate logs on each machine and try to find the information that you are looking for, and then try to correlate different events across different machines, perhaps by their timestamp, to understand what went wrong.
This is not what we want. Having all these different logs hosted in different locations makes the correlation and analysis difficult and on top of that, through the process of log rotation, it might be possible that the log file you're looking for has been rotated out and deleted forever. Ideally we would bring together all these logs into one central place, where we can analyze the logs in aggregate and come up with a uniform back-up strategy for them.
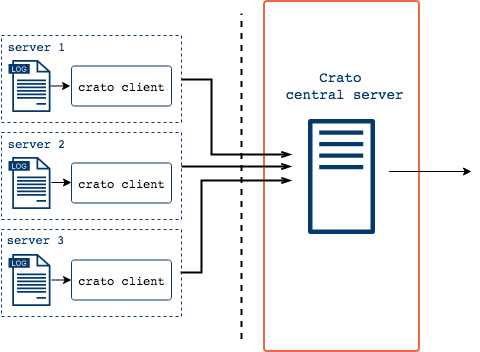
Syslog can also help with forwarding log events across machines. It does this by having facilities for both sending and receiving log events: a syslog daemon for each log-sending machine and a syslog daemon on the log-receiving machine where all log data is to be centralized.
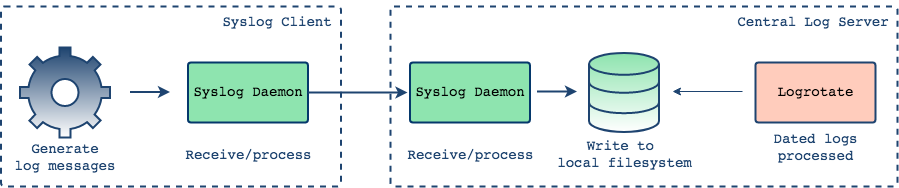
This time, the syslog daemon on each of your components captures log messages but instead of simply writing them to a file, it forwards messages to a remote machine where another syslog daemon accepts them. Here, it's possible to view our logs as a consolidated whole. Already this is a big improvement from the disjointed scenario we had above.
Now you can inspect all your logs from a single place and you don’t have to rely on connecting to every machine individually; you can directly see the logs from the same filesystem. This also makes for a far more reliable way to access logs because even if one of these clients becomes inaccessible, all logs up to the point of the client's failure are already in the central server.
Now we have a much more desirable and more manageable situation and this is the basis for a centralized logging architecture. Once all logs that are relevant to your application are consolidated in one place, their value in aggregate starts to become more apparent.
Whether you want to use simple command line utilities like
grep, ship your logs somewhere else, or visualize them
using the many monitoring and visualization tools that exist, it can
only be possible once the logs are centralized. In the next section,
we'll enumerate over some solutions to help developers set up a
centralized logging architecture.
What solutions exist for a small and growing application that wants to manage its own logs?
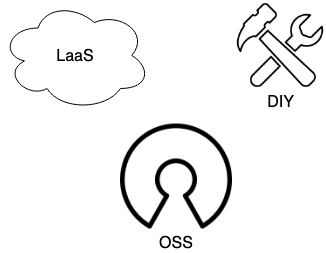
Three main types of log management solutions
To quickly survey the available options, let's distinguish between three main categories of log management solutions. Logging as a Service (LaaS) consists of paid, proprietary, typically cloud-based systems. The Do it Yourself (DIY) path involves designing and building a custom, self-hosted solution from a variety of components. Finally, the Open-Source Software (OSS) solutions are open-source, pre-designed centralized logging systems that you deploy on your own machines.
Full-service Logging as a Service (LaaS) products provide their customers with the full range of options, including most - if not all - of the following log management functions: Log Collection, Ingestion & Storage, Search & Analysis, Monitoring & Alerting, Visualization & Reporting.
LaaS solutions are generally cloud-based. They're designed to be easy-to-use and they provide a rich feature-set along with technical support. The most difficult part in working with a LaaS may be configuring your machine(s) to forward logs into the service. Once the data is ingested, the LaaS handles the rest. The major advantage of buying a LaaS product is convenience and ease of setup.
The drawbacks however are also apparent. The services aren't free, and costs can fluctuate based on a number of factors, including the volume of data being ingested, the number of users, and storage or retention plans. Nor is it simply an issue of costs. Whether cloud-based or on-premise, proprietary solutions are marked by a lack of ownership: users cede control of their data to a third party, and they are unable to inspect, modify, or audit proprietary code.
For some, giving up control of sensitive data is prohibitive, so another option would be to build your own.
Another approach to managing logs is to Do It Yourself (DIY). The DIY approach allows developers to design and build a system out of pre-existing components. The key components for a centralized log management infrastructure are below.
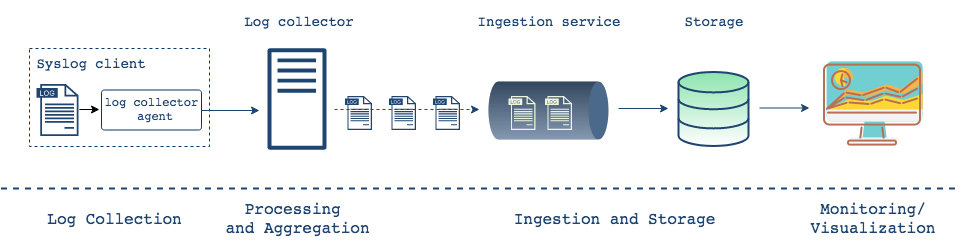
Key components in a log management system
Log collection occurs on each machine with Syslog daemons, also known
as agents, listening for messages generated by applications and system
processes. When new events are generated, the agent(s) collects them.
There are alternatives for Syslogd, the standard Syslog
daemon which can collect, process, and transport logs7.
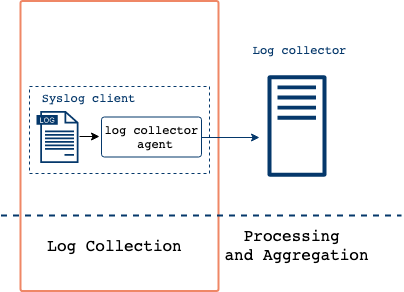
Logs can be collected and transported from each client machine and forwarded to a central log server using different systems built on top of the Syslog daemon.
Syslog, and its more recent implementations rsyslog and syslog-ng, are
commonly found on *nix systems, and are even available on
Windows. Because of this ubiquity, DIY systems are often able to
directly work with one or another of these syslog implementations for
log collection. Other options exist as well but syslog implementation
is the standard.
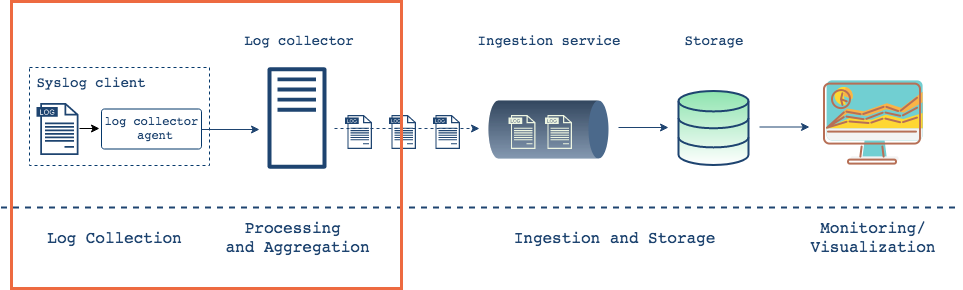
Once collected from each client, logs are aggregated in a central location
After collecting logs from each client, the next step is to aggregate these logs on a single machine. To accomplish this, a logging system must 'ship' or forward the logs to a centralized server. Here, the logs may be parsed and transformed into formats like JSON, enriched with context and stored. There is a healthy amount of options from which to choose here, and choices will depend largely on application need.
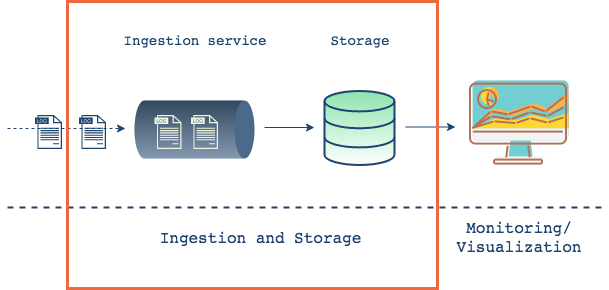
Logs ingested into storage
Once logs are collected, the goal is to transport them to a storage service from which they can be searched and analyzed. If the write rate of the chosen data store is compatible with potentially bursty influx of logs into the system, then the logs could be sent directly to storage. However, not all applications will be able to rely on this throughput parity. Applications that need to scale, or that expect wide fluctuations in data flow, would likely do better by decoupling log aggregation and storage. This can be handled in a number of ways, and a common option is to use a messaging system. Doing so would provide a more robust, fault-tolerant system, along with the ability to handle higher throughput. But it also introduces additional complexity.
Here, as with the other components, there are a number of options to choose from. The design and implementation choices will depend on a number of factors. Relevant considerations include the following:
Finally, once data is in a database, we can connect it to a visualization tool for more user friendly analysis and reporting. Some of these tools also provide alerting and system configuration capabilities. The visual representation of data allows users to transform and aggregate in more effective ways. There are many open source options here, with Kibana and Grafana as the leaders.
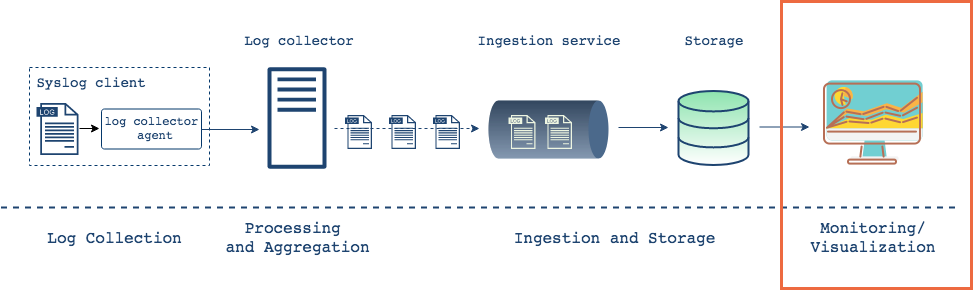
Visualization tools provide convenient insight into a system's performance
Ultimately, if you decide to DIY a central log management system, at each layer you will have several options available.
Overall, doing it yourself (DIY) and building a custom system allows for greater control and flexibility at the cost of complexity. Custom systems can address very precise needs, and they can provide high control of data and security. But it requires a dedicated team to setup, configure, and maintain the system.
The final category of log management solutions consists of open source pre-designed systems. These tools allow a developer to maintain higher levels of data control with an ease-of-use closer to LaaS tools. However, they typically require self-management and hosting. The two main solutions here are the Elastic Stack and Graylog.
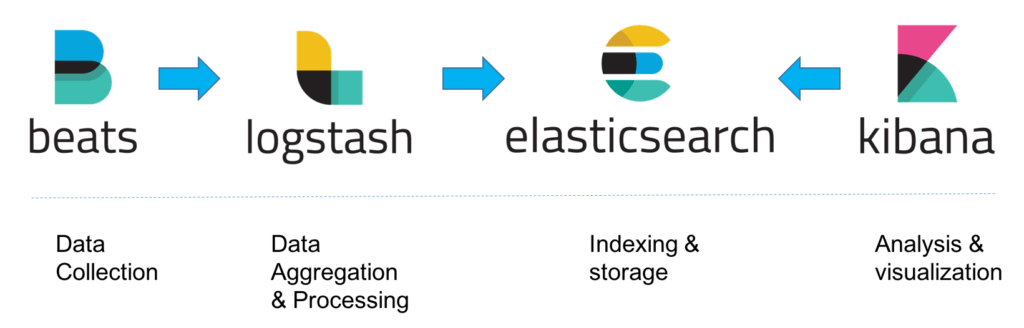
Elastic Stack Architecture
Elastic develops a collection of open-source log management products designed to work well together. Altogether, they have products that cover each of the four key phases of centralized log management. In fact, 'ELK' refers to a frequently-used combination of their tools, comprised of the text-search storage system ElasticSearch, the log collection and storage service Logstash, and the visualization/monitoring tool Kibana.
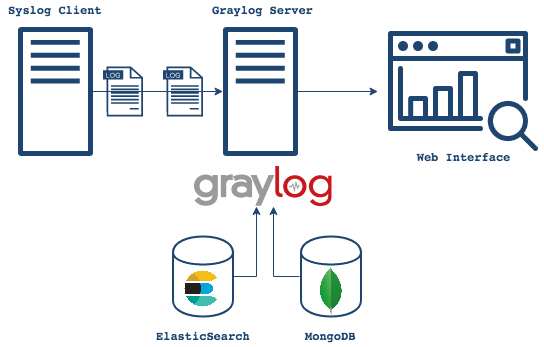
Graylog architecture
Graylog is a company and open-source centralized log management server. It is built on top of ElasticSearch and MongoDB and offers a web interface connected to the server. In addition to their OSS self-hosted option, Graylog provides a LaaS as well.
The Elastic Stack and Graylog are very popular open-source self-hosted solutions. Each offers the expected ease of use, along with the potential for data ownership and security assurances that come from self-hosting. There is a rich ecosystem of plugins for each tool, thus offering extended flexibility. However, these systems are more complex than LaaS. You'll need to configure, deploy, maintain, and potentially scale these systems yourself.
We can now finally situate Crato. To do so, we will first quickly summarize the landscape of options and their tradeoffs.
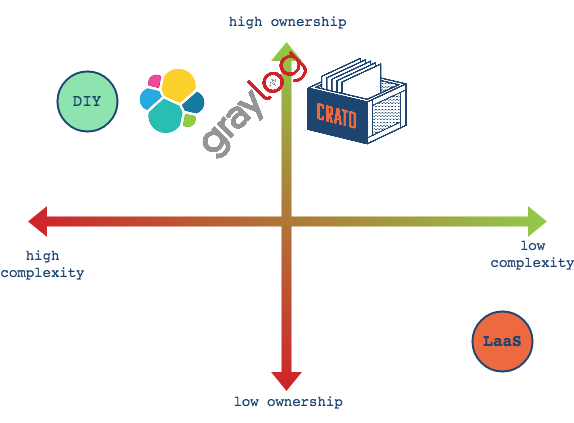
While LaaS options provide the quickest and most simple path, their advantages come with costs. Not only must users pay for LaaS services, but their applications' data is yielded to a third party. DIY options grant users the most control, and can be designed and built to include precisely the features wanted. But there are tradeoffs here as well. The high level of control and customizability comes with increased complexity and additional design and maintenance commitments. Finally, the pre-designed OSS options aim to split the difference between LaaS and DIY. OSS options return data control to the users (typically lacking in LaaS) while reducing complexity and design and maintenance commitments (both of which tend to be high in DIY projects).
But even here in the OSS options, there is a range of complexity, which is largely attributable to the database and full-text search choices of the OSS stacks. Crato reduces complexity even more by eliminating the need to set up and maintain a full-text search engine. Thus, Crato is designed to provide the core features of centralized logging while reducing complexity and time commitments.
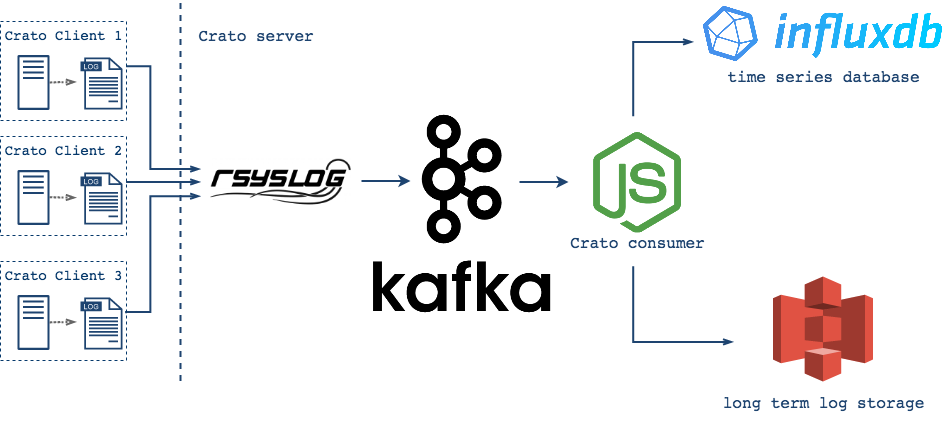
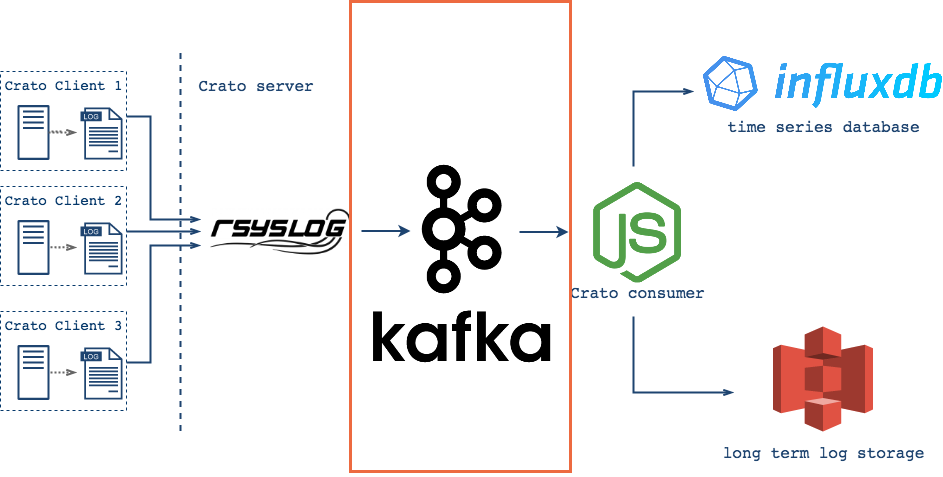
Crato consists of two main components: the Crato Client and Crato Core. The client is installed and run on each machine from which logs are to be collected. The core infrastructure is deployed via Docker onto a separate server or VPS.
Crato Client is designed to have a light footprint on each client
system. Downloading the client adds only two files to each system: the
crato bash script and crato-config, a text
file to record user preferences. Running Crato client interferes with
the native logging of the system as little as possible. Crato adds
only a single configuration file that supplements, not overrides,
default settings.
crato-config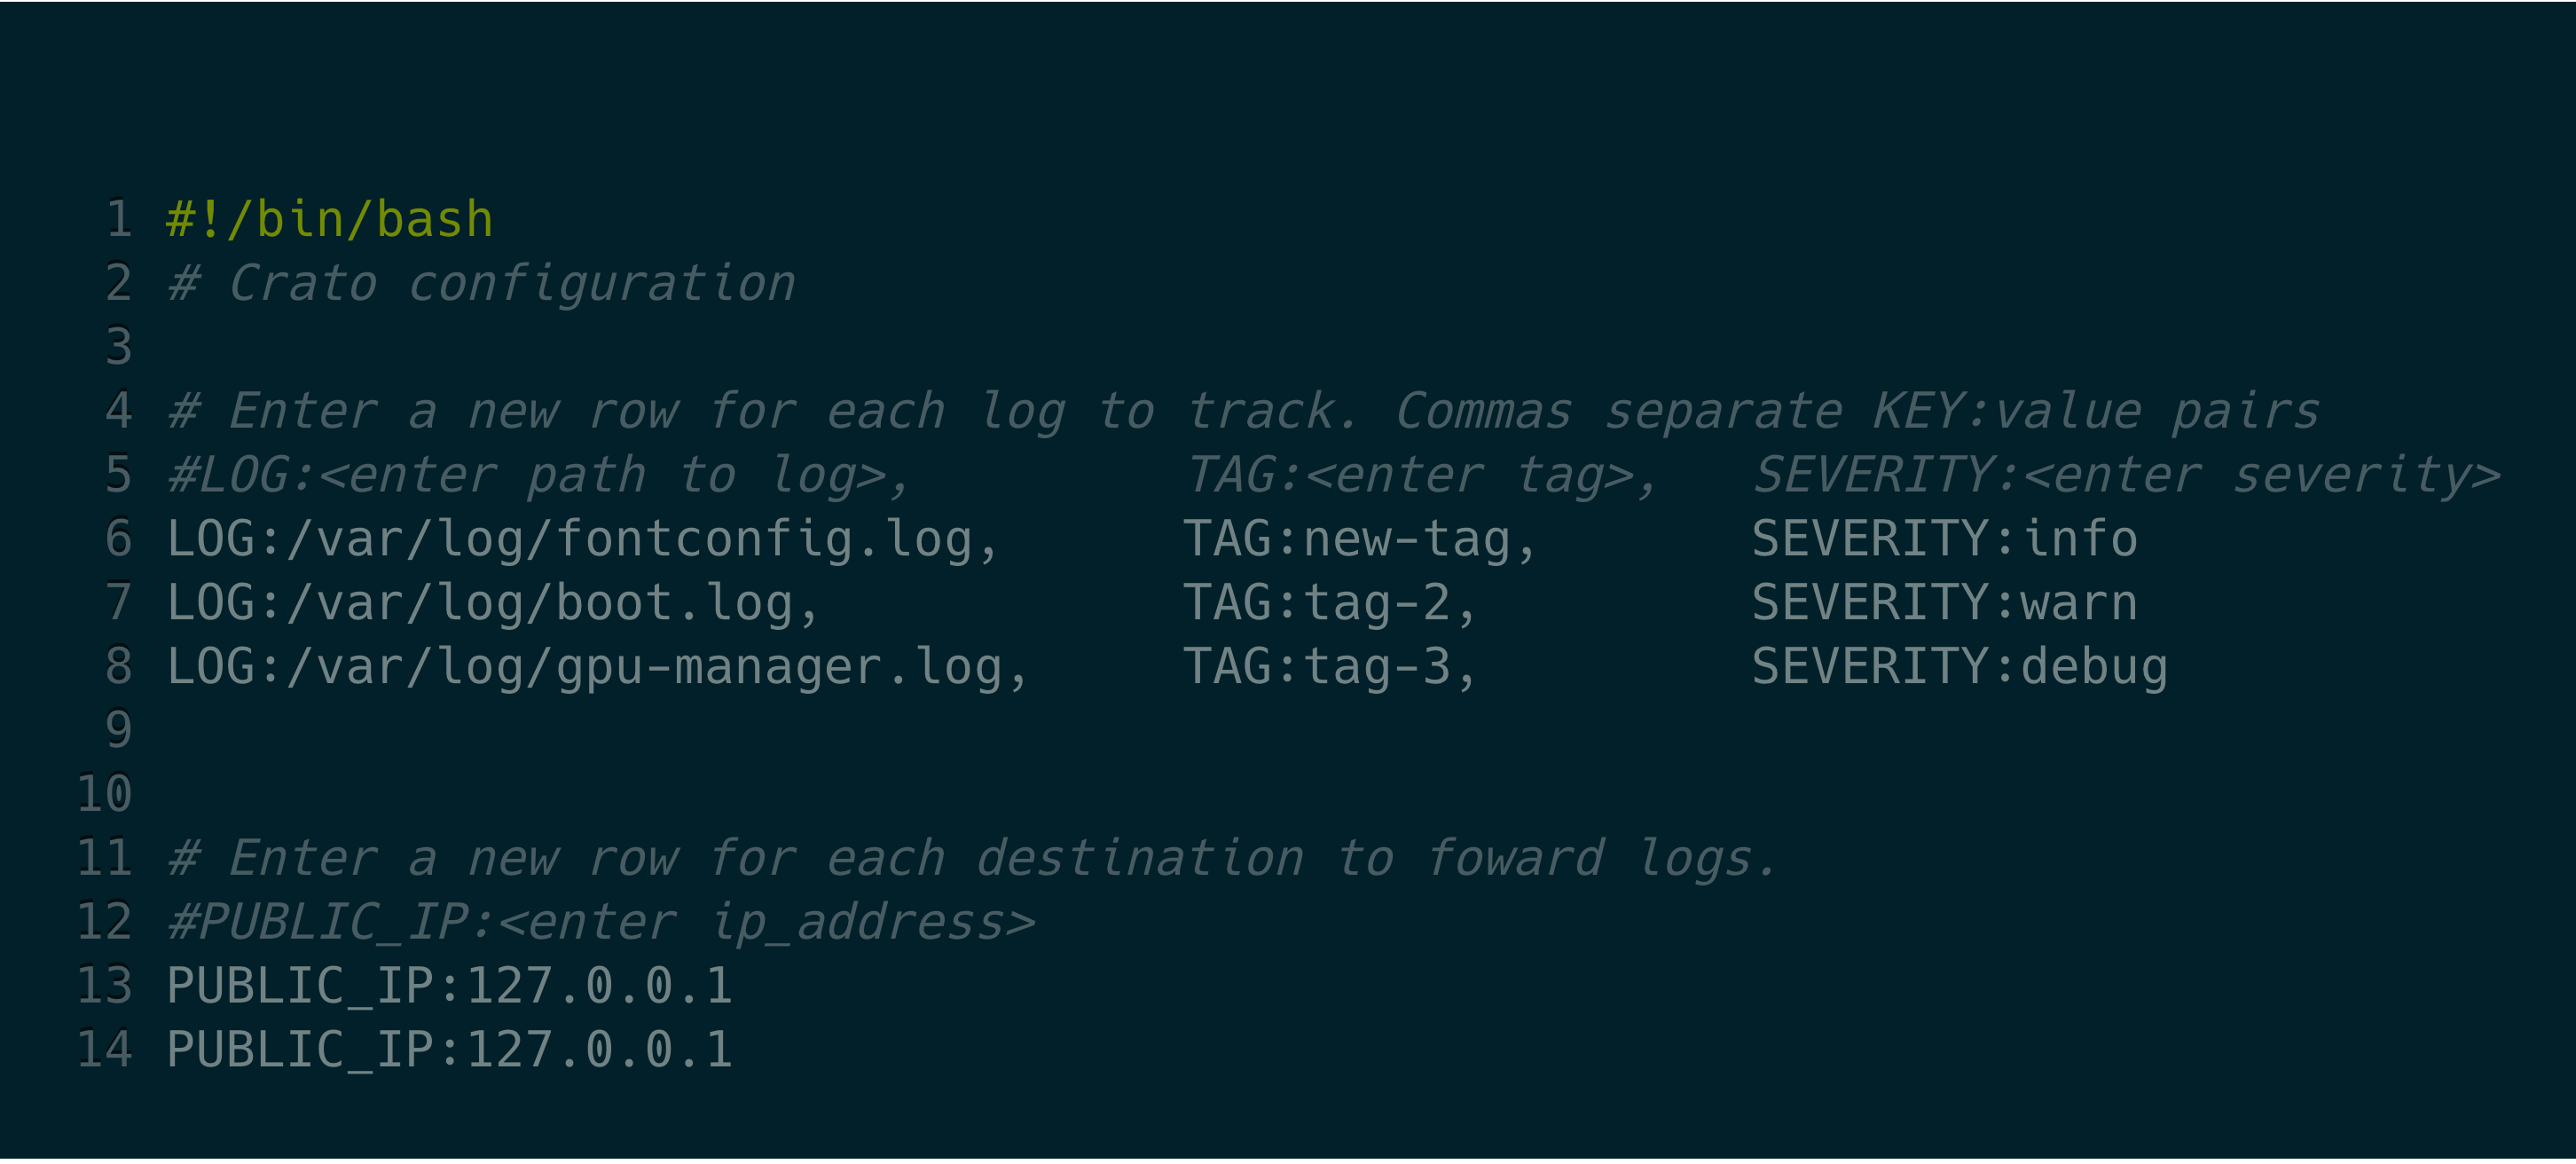
To simplify deployment and reduce complexity, the Crato client CLI
exposes only a handful of configuration options. Crato client
configuration options are set in the crato-config text
file. Using key-value pairs, enter any number of logs for Crato to
track, along with their tags and severity levels. Then enter the ip
address of the central server.
For users needing more granular control over settings, the full range
of configuration options are available by directly editing the default
*.conf files. Because Crato does not override
applications' logging processes, these can be configured as before.
The Crato client command interface is also designed to be simple and easy to use.
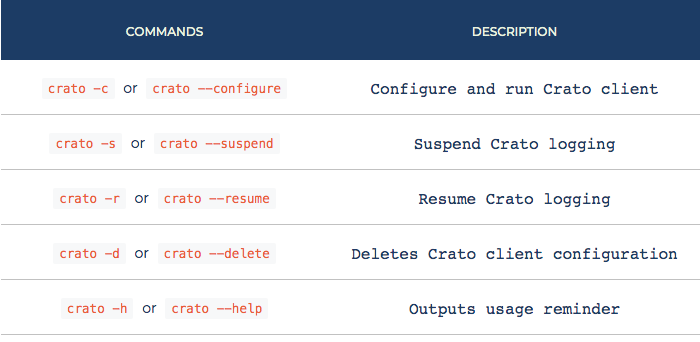
Crato client's CLI commands in use
Apply the current configuration and start Crato client with
crato -c or crato --configure. Running this
command checks that permissions, rsyslog version and base
configuration is appropriate for Crato client. It then dynamically
generates a /etc/rsyslog.d/49-crato.conf file (numbered
to avoid collision with default configuration files) to hold Crato
configuration, and checks the validity of the resulting
rsyslog configuration. It then either throws an error
with instructions for debugging or (re)starts logging with the new
settings.
crato -s or crato --suspend suspends Crato's
logging on the client and returns the machine to default logging.
crato -r or crato --resume restarts Crato
logging on the client with the suspended settings resumed. If Crato
client was not suspended at the time of execution, then the command
makes no changes.
crato -d or crato --delete removes current
or suspended Crato client configurations, confirms that resulting
default configuration is valid and restarts logging with default
settings or throws an error with instructions for debugging.
crato -h, crato --help, or even
crato
without flags provides help by displaying a usage screen.
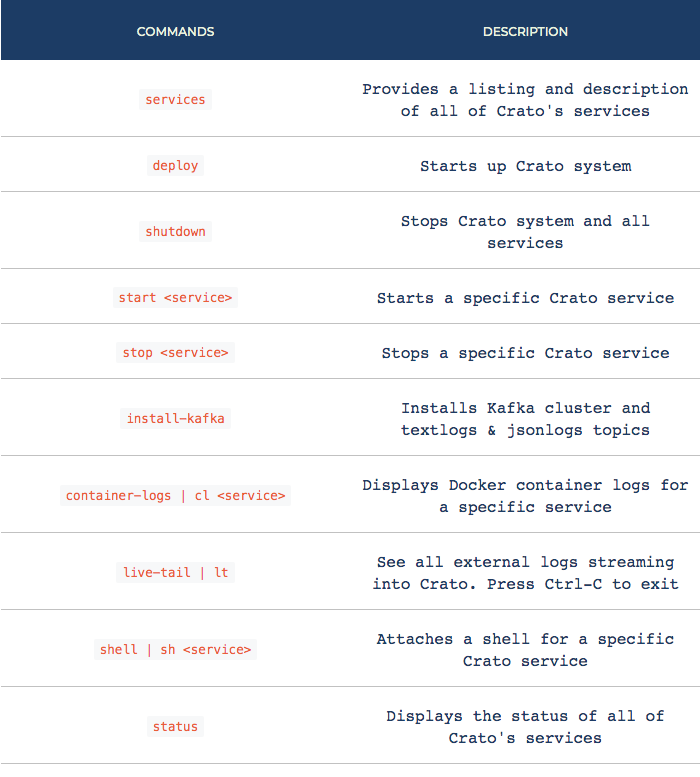
Crato infrastructure installs and deploys with just two commands
The Crato CLI is designed for developer convenience. It abstracts away from Docker CLI, installs services in-order, and provides common CLI log management functionality such as live-tailing and shell access.
As an example of the convenience provided by the CLI, let's look at
the crato install-kafka command. Apache Kafka is often
considered hard to configure, but this one command starts Zookeeper,
creates a pre-configured three broker cluster, and also creates a
textlogs and a jsonlogs topic.
The install-kafka command is one instance of the Crato
CLI that abstracts away multi-step commands. Kafka is often regarded
as difficult to install and configure. In fact, even with a service
like Docker handling most of the configuration there is still some
manual work needed. Compared to the Crato CLI, the equivalent commands
via Docker are still numerous and not easy to recall. There are 5
steps:
docker-compose up -d zookeeperdocker-compose up -d kafkadocker-compose exec kafka kafka-topics --create --zookeeper
zookeeper:8092 --replication-factor 3 --partitions 6 --topic
textlogs
docker-compose exec kafka kafka-topics --create --zookeeper
              zookeeper:8092 --replication-factor 3 --partitions 6 --topic
              jsonlogs
docker-compose stop
The Crato CLI as shown above simplifies this process into 1 step:
crato install-kafka. Below are some other Crato CLI
commands.
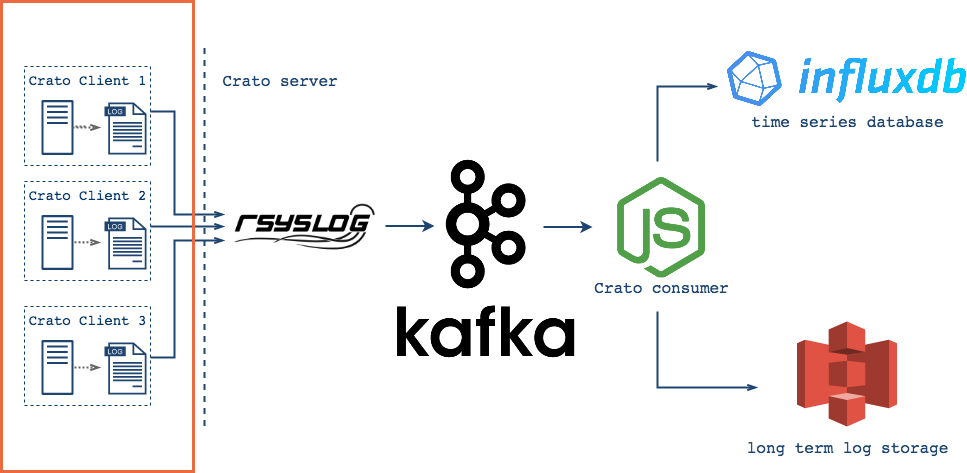
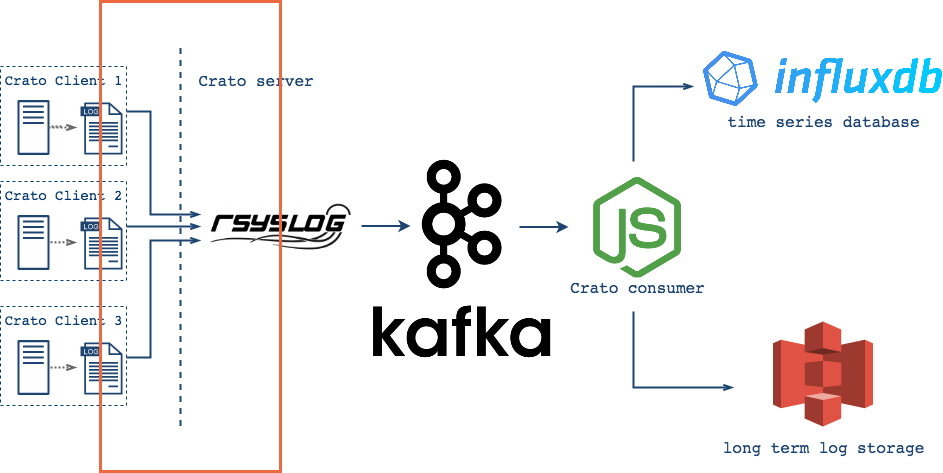
Following our design goal of being a lightweight, easy-to-use system,
Crato collects logs using rsyslog, a standard tool
available on most *nix systems.
System logs and designated application logs collected into single stream.
At the user’s discretion, Crato can collect any text-based log
messages your servers, applications, databases, etc generate. Captured
log messages are consolidated into a single stream along with system
logs. Together, these messages are persisted to disk in the
syslog file on each client machine and also routed for
processing and forwarding.
Crato clients monitor logs, forwarding messages as they arrive for ingestion into the core Crato infrastructure.
So far, the logs are grouped into a single stream, which is being written to a single file. This occurs on each client (physical machine or virtual server). But the primary goal of centralized log management is to collect logs from many different sources into a single, central (offsite) location. To accomplish that goal, we need to ship the logs to some other server.
Each system running a Crato client forwards the stream of captured log
messages via tcp to the offsite core of Crato's
infrastructure. To mitigate message loss resulting from a network
partition or problems with the central server, each Crato client
implements a disk-assisted memory queue in front of the forwarding
action.
Why default to TCP? At our expected volumes, the disk-assisted memory queue (a linked list capable of holding 10000 individual log messages, with 1Gb disk space available if needed) should mitigate the need to fire and forget to keep up with traffic. Thus, Crato opts for TCP and its guarantees of delivery and packet order over UDP's potential speed gains and absence of guarantees.
As it receives new log events from the dispersed clients, the central
log server appends each message to its own log file. At this point,
the central collection server's syslog file contains all
captured messages from the clients along with those from the
collection server itself. The full text is available for CLI query
using familiar text processing tools like grep,
tail, sort, and awk.
Central point for insight into entire system: all messages available to familiar Unix tools.
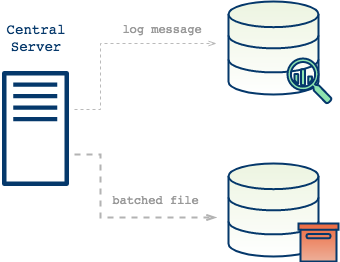
Central log servers also forward logs into Crato’s pub-sub system, where they are made available to both the archiving server and to the database.
It is common practice for log management systems to persist log data not only to save it from automatic log rotation jobs, but also to facilitate metrics and other system analysis. Crato follows this practice as well, with logs being saved for archiving and also made available for querying.
But then couldn't Crato's central server send logs directly to the persistence layer? Yes, in fact it's earliest iterations did exactly that, but this approach is sub-optimal for a number of related reasons.
Logs are produced at different rates than they are consumed. Furthermore, the same log data will be used by multiple processes. Each use can be expected to have different needs, to operate at a different rate, and to have potentially different bottlenecks or failure rates. As a result, sending a copy of each log message to each consumer as they come in is likely to lead to dropped messages with no good way of recovery. Crato needed a buffering system to capture logs and allow each consumer to draw data at its own rate.
One way to address this problem would be to use a queue. Log messages are sent into a queue, and a consumer shifts the next message off as needed. This may would work well for an individual consumer, but Crato needs to handle multiple consumers, and as each consumer grabs the next available message from the queue, all the others miss out. The message is no longer available. What Crato would need would be a queue in front of each potential consumer. To implement that, the central server would need to send a copy of each log message to n queues in front of n consumers.
Another potential solution would be to use a publish-subscribe messaging system. The central server would publish each new log message to the platform, and all subscribers would receive the log as it is available. While this model allows the central server to forward its stream to a single destination, it does not account for the different rates of consumption.
What Crato needs is a way to provide the same stream of log messages to multiple consumers, to allow producers and consumers to work at their own paces, and for each to always be able to resume its work at the exact point it left off. It needs the advantages of a queue and a pub-sub system folded into a single platform. Apache Kafka provides exactly that.
The consumer group concept in Kafka generalizes these two concepts. As with a queue the consumer group allows you to divide up processing over a collection of processes (the members of the consumer group). As with publish-subscribe, Kafka allows you to broadcast messages to multiple consumer groups.
By decoupling log creation or ingestion from log use, Kafka solves the problem noted above, namely Crato's need for exactly once delivery of log messages to multiple users operating at different paces. At the same time, it also allows Crato to be more extensible in the future. Any additional uses for the same data can be added as consumers.
But if Kafka is so effective at managing this decoupling, wouldn't Crato benefit from skipping the central server model and simply have each client produce directly to remote Kafka brokers instead? There are advantages to this approach. It would reduce complexity in Crato's core infrastructure, and there is no doubt that Kafka could handle the load from multiple distributed clients as well as it does from a single central log server.
That said, this design would increase the complexity on the client
side by introducing additional configuration requirements and
dependencies. If we want to use the syslog protocol on
each client (see the justification above), then an
rsyslog central server poses fewer problems for client’s
installation. Also, removing the central server would eliminate one of
Crato's UI advantages, because without a central collection point it
would lose the ability to provide system-wide observability using the
familiar *nix text processing tools. One of the design goals is 'easy
to use'. Asking users to query Kafka for observability pushes hard
against that goal.
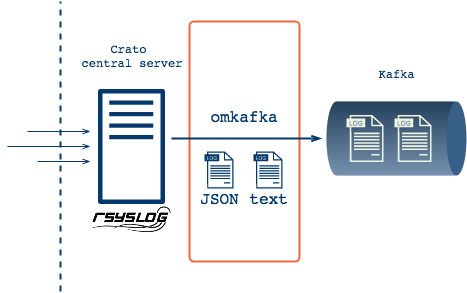
With Kafka in place, Crato's central collection server sends plain
text and JSON formatted log messages to Kafka brokers via
rsyslog's omkafka module. Early tests of
Crato with a single Kafka broker revealed that the broker would not
always be available to receive messages. To reduce the potential for
log loss, Crato is now built with a three broker Kafka cluster, thus
preserving service even if two brokers fail. Additionally, it employs
on its central server a disk-assisted memory queue to mitigate
partitions between server and Kafka cluster, and to provide an
emergency store of unsent messages if rsyslogd shuts
down, or in the event that all Kafka brokers are down.
Although the logs are buffered, and Kafka provides delivery guarantees for Crato's multiple consumers, the actual consumption is not automatic. That is, Kafka will hold the messages for their specified time-to-live (pending available disk space), but the consumers must make the requests and manage flow to suit their endpoint's needs.
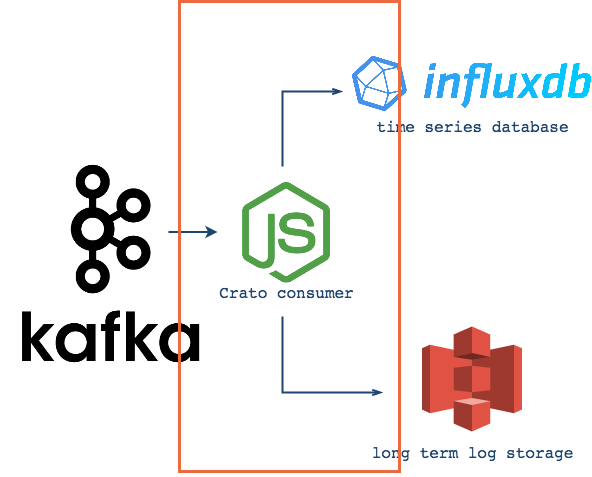
As a result of this pull model, Crato is built with two consumer groups, one for batching and one for streaming. The batching consumers save logs to a json file until it reaches a configurable size, and then send the file to Amazon S3 Glacier. The streaming consumers redirect incoming log messages and serve them to their appropriate measurements in InfluxDB.
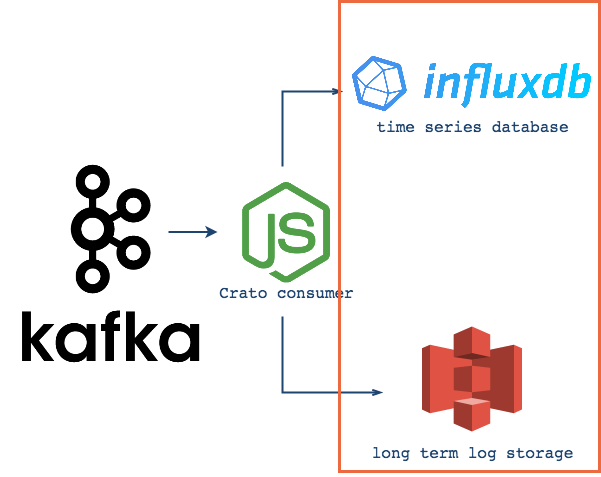
In order to provide the full advantages associated with centralized logging, a platform would need to store logs and to make them available for queries. Of course, this could be accomplished with a single data store, but Crato takes a different approach, because there are actually two very different needs here.
First, (as discussed above) there is value in archiving logs, i.e. setting them aside in files for long-term preservation. Second, storing individual log messages for metrics based queries provides unique insight into a system's performance. Crato's storage is designed with the idea that these different needs should be addressed separately. As a result, Crato uses two forms of storage with distinct sets of criteria.
Crato uses Amazon S3 Glacier for archival log storage. Users enter their AWS credentials and a destination S3 bucket name when deploying Crato core, and Crato takes care of the rest. Establishing and configuring an AWS account are handled directly through Amazon.
Using S3 for log file archiving gives Crato's users offsite storage with 99.99..% durability and automatic lifecycle management (configured via AWS console) at a competitive price. Furthermore, because Crato archives in JSON format, the files themselves are queryable from AWS console. As a result users may have an easier time determining which files they wish to extract.
Emphasizing metrics-based queries, Crato should be able to track entities (e.g. servers, applications, processes) through their logs as they change across time. Seen in this light, logs can be understood as containing time series data, and therefore as ideal candidates for time series databases. Consider the following distinguishing characteristics of time series data and databases.
Time Series Data: sequences of data points from individual sources over time
Time Series Databases: databases built for collecting, storing, retrieving & processing TS data
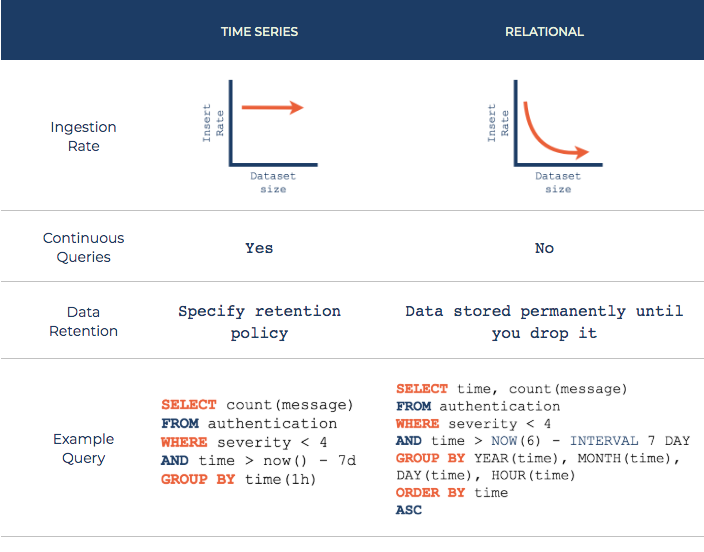
Comparison of time series and relational databases
Although other forms of database can be used for time series data, they often lack the tooling to make working with time series easy . The chart above compares time series and relational databases. Time series databases tend to be optimized for fast indexing by time. While other database types tend to slow down due to indexing as the data set grows, time series databases tend to keep a consistently high ingestion rate. Also, time series databases make running a continuous query simple. When performed over a short retention period measurement, a continuous query allows live monitoring of, for example, a server's response rate.
Crato deploys an instance of InfluxDB for queryable storage. Since most time series databases have similar optimizations, and they tend to be immersed in an ecosystem that allows easy integration with visualization tools, the decisive factor in using InfluxDB is the fact that it is schema-free. As a result, when a Crato consumer sends logs to InfluxDB it automatically creates a new measurement (table) for each new log source. That means that Crato's users can benefit immediately, and will also be able to add new clients without having to declare new schema.
A problem that arose early in Crato's design was how to efficiently and reliably collect logs from client systems without imposing on the developers' application code. The very nature of centralized logging framework requires extraction of logs from machines and environments over which the framework has little or no control. As a result, every byte of code deployed on a client system is a potential liability. Ideally, Crato would be able to collect logs from clients without altering any code or impacting the original environment in any way. But this is just an ideal. Instead, we chose to work with the least invasive techniques we could find that still allowed reliable log collection. We evaluated and excluded two popular options before deciding to use rsyslog.
The first option was to install an active collection agent on user's servers. This approach would give Crato as much control as possible over the conditions of log collection, so it was tempting to follow this approach. Nonetheless, it carries with it considerable risks of deploying code into an untested situation, and of interfering with the original applications. We considered this approach too invasive, and it certainly violated Crato's goal of being lightweight.
The other main option we considered was to integrate with an application logging library. The idea would be to use an existing library to send logs into Crato's core infrastructure. The first obvious advantage to this option is that many application logging libraries are already familiar tools to developers. If Crato were to integrate with a familiar library, it would not itself need to intervene directly in any way on a user's machine. Furthermore, users could continue to use familiar tools. Unfortunately this approach would substantially narrow the scope of users to those already working with the library, or at least those already coding in a given language or with a certain framework. Also, this approach would limit the logs collected to only those intercepted by the library in question.
So, with the first option too heavy-handed and risky, and the second
too limiting, we opted to adapt rsyslogd, an already in
place system-level logging daemon to collect from applications as well
as from its default system processes. By doing so, Crato is able to
create customized configurations that supplement, not override, the
functioning of existing rsyslog configurations.
Crato uses the Rsyslog Omkafka module to produce to Kafka. Although this approach simplifies the technical aspects of sending logs to Kafka, writing the configuration scripts requires learning Rsyslog's DSL, Rainerscript (named for Rsyslog's founder). While the DSL is well-documented, we decided this would be too much to ask of Crato's users. As a result, we decided to include these ourselves, automatically configuring Rsyslog when the central server is started up.
In testing we quickly realized that our original configuration of Omkafka left Rsyslog too tightly bound to Kafka. With even a momentarily unavailable Kafka broker, we began to see error messages propagate through the system. While seeing these messages in Kafka demonstrated that the pipeline was resilient and had continued to work, they also indicated that Crato needed to decouple rsyslog from Kafka. More specifically, it need to decouple rsyslog from any particular Kafka broker. We approached the decoupling from both sides.
On rsyslog's side, to address complete Kafka failures, connection partitions, and bursts of logs that exceeded forwarding capacity, we added disk-assisted queuing to the rsyslog output module. This greatly increases the probability that log messages will eventually get to Kafka even under adverse conditions.
On the Kafka side, we added two more brokers. With a total of three nodes, the Kafka cluster would continue to provide service with as many as two failed or otherwise unavailable brokers. Doing so took some of the burden off of the disk-assisted queues, but more importantly it increased the fault-tolerance and reliability of the entire ingestion side of Crato.
Crato is built to handle logs from multiple clients, and on each
client, multiple applications and services are likely to be logging.
With so much diverse data coming into the system, finding order in the
chaos and storing the logs in an easy to reason about way is a top
priority. An initially promising approach is to use the logs'
host property to route and store logs from each machine
in their own measurements. (InfluxDB measurements are roughly
analogous to SQL tables, with each measurement storing related data
over time.)
Indeed, this may be a good option in many or even most cases, but it is not always ideal to group logs by host. Given that many services may be logging from each host, it may be that storing kernel logs in the same measurement as web framework logs won't be very enlightening. We certainly need to be able to identify logs by their host origins, but defaulting to this overlooks the possibility of greater granularity in our filtering and routing.
With these factors in mind, ultimately we chose to group logs by their
syslog-tag property. With this option users of Crato have
the most flexibility. Because this property is configurable on each
Crato client, users may determine the grouping of logs into
measurements in InfluxDB. So, for instance, users could group together
logs that share a similar function
as opposed to simply bundling them by source, although this remains a
possibility as well.
As written, then, Crato allows users to automatically configure the
filtering of messages into measurements simply by adding the same
syslog-tag
to each log source in Crato client, whether on a single machine or on
many. Additionally, Crato filters and stores all messages with 'err'
severity or greater in a single measurement, and groups all
authentication messages into another.
After testing Crato using independent, hand-configured servers, we had to consider how to package everything together in a feasible manner for any developer. A framework designed to make logging easy can hardly ask users to hand code configurations or even to copy a set of provided files from a repository. Nor can they be expected to deal with any of the following concerns.
In order to deploy Crato, we needed reliable networking so that our services could easily communicate with each other and remain secure. We also needed a way to implement ordering of services, so that services (E.g. Kafka) would only attempt to communicate with one another when dependent services (E.g. Zookeeper) were ready. Furthermore, we needed a system that would orchestrate and run all necessary commands to create each service including our application. Finally, we needed a powerful interface to manage these services. In order to meet all these needs, and to hide the complexity from Crato users, we decided to use Docker. Using Docker, we were able to package all of the aforementioned services in containers, simplify networking, and provide a robust but clean interface to manage service interaction.
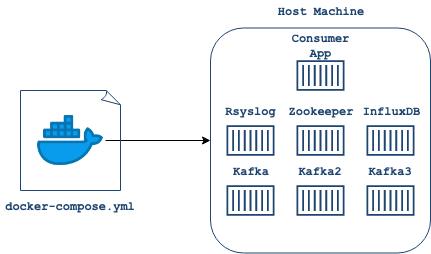
Docker uses the docker-compose.yml file to find images
and build containers for services.
Using Docker brought many advantages. With Docker containerizing each of our services, we were able to isolate issues and expose an interface for additional development work and querying via shell. By using officially supported Docker images for Apache Kafka, Apache Zookeeper and InfluxDB we were able to ensure Crato's services will always be up-to-date. The project required us to build a custom image of Rsyslog to install necessary modules and to copy key configuration files. Docker's tooling made this easier, and it also created a single network for all services, thus allowing containers to communicate with each other easily without exposing ports to external traffic. Finally, Docker allowed us to enforce a start up order.
If you liked what you saw and want to talk more, please reach out!

San Francisco, CA

New York, NY

Toronto, Canada